
What you like on Facebook might say something about how obese your neighborhood is. (Dry Martini/Wikimedia Commons)
But if a researcher were to look across Boston at what people who are like me like—and post and share—on Facebook, a snapshot of data could tell them something else: roughly how obese metro Boston is.
That’s essentially what John Brownstein, PhD, and Rumi Chunara, PhD, concluded in a study recently published in the journal PLoS ONE. In it, they combined Facebook interest data—an aggregate of what people “like,” post on their timeline or share on others’ timelines—with health survey data to geographically correlate activity or television interests with obesity rates.
The take-home message from their study was that as the proportion of Facebook users in a given geographic area with an interest in television-related topics increased, so too did that area’s rate of obesity. On the flip side, as the proportion of users within an area with health & wellness- or outdoor activity-related interests grew, the obesity rate shrank.
The results, which held true for both national obesity estimates and those for just New York City, suggest that social networks like Facebook could hold great power for helping map data about obesity (and other chronic diseases) down to a fine level of geographic detail. And given Facebook’s capability to target advertisements geographically, the study may also open the door to new ways of delivering information for combatting obesity.
The research also adds to the growing evidence that all manner of digital data—Facebook, Twitter, Google searches and more—hold great power for augmenting traditional methods of chronic and communicable disease surveillance.
“Online social networks like Facebook represent a new high-value, low-cost data stream for looking at health at a population level,” Brownstein, who runs the Computational Epidemiology Group within CHIP, said in a press release. “The tight correlation between Facebook users’ interests and obesity data suggest that this kind of social network analysis could help generate real-time estimates of obesity levels in an area, help target public health campaigns that would promote healthy behavior change and assess the success of those campaigns.”
So what does your Facebook page say about your neighborhood?
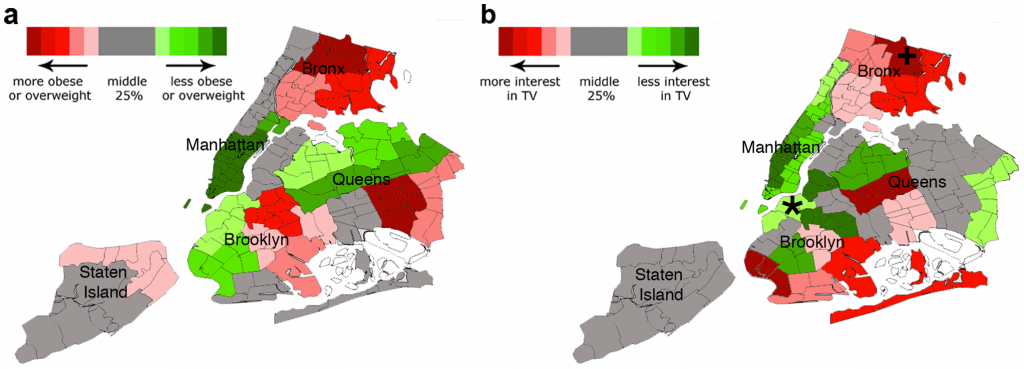
A pair of maps correlating Facebook TV interests (right) with obesity rates (left) in New York City neighborhoods. Red means higher obesity rate or higher proportion of Facebook users with TV interests, and green the opposite. (PLoS ONE, doi:10.1371/journal.pone.0061373.g004)